Hydrobase
AI workspace for environmental & engineering consulting

Every report, lab result, and map, in one connected workspace.

Bring reports, lab results, water levels, and GIS data into one shared AI workspace. Find source-backed answers instantly, build on earlier analyses, and create figures and reports your team can review and improve together.

Aerial photograph of a river winding through green meadow.
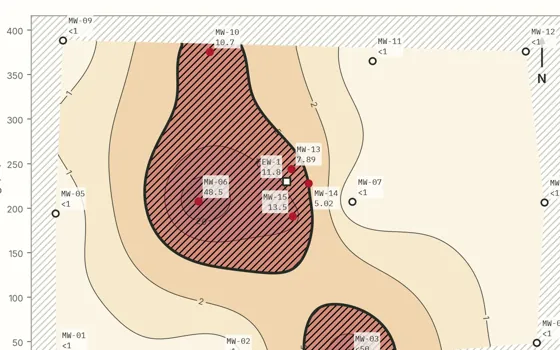
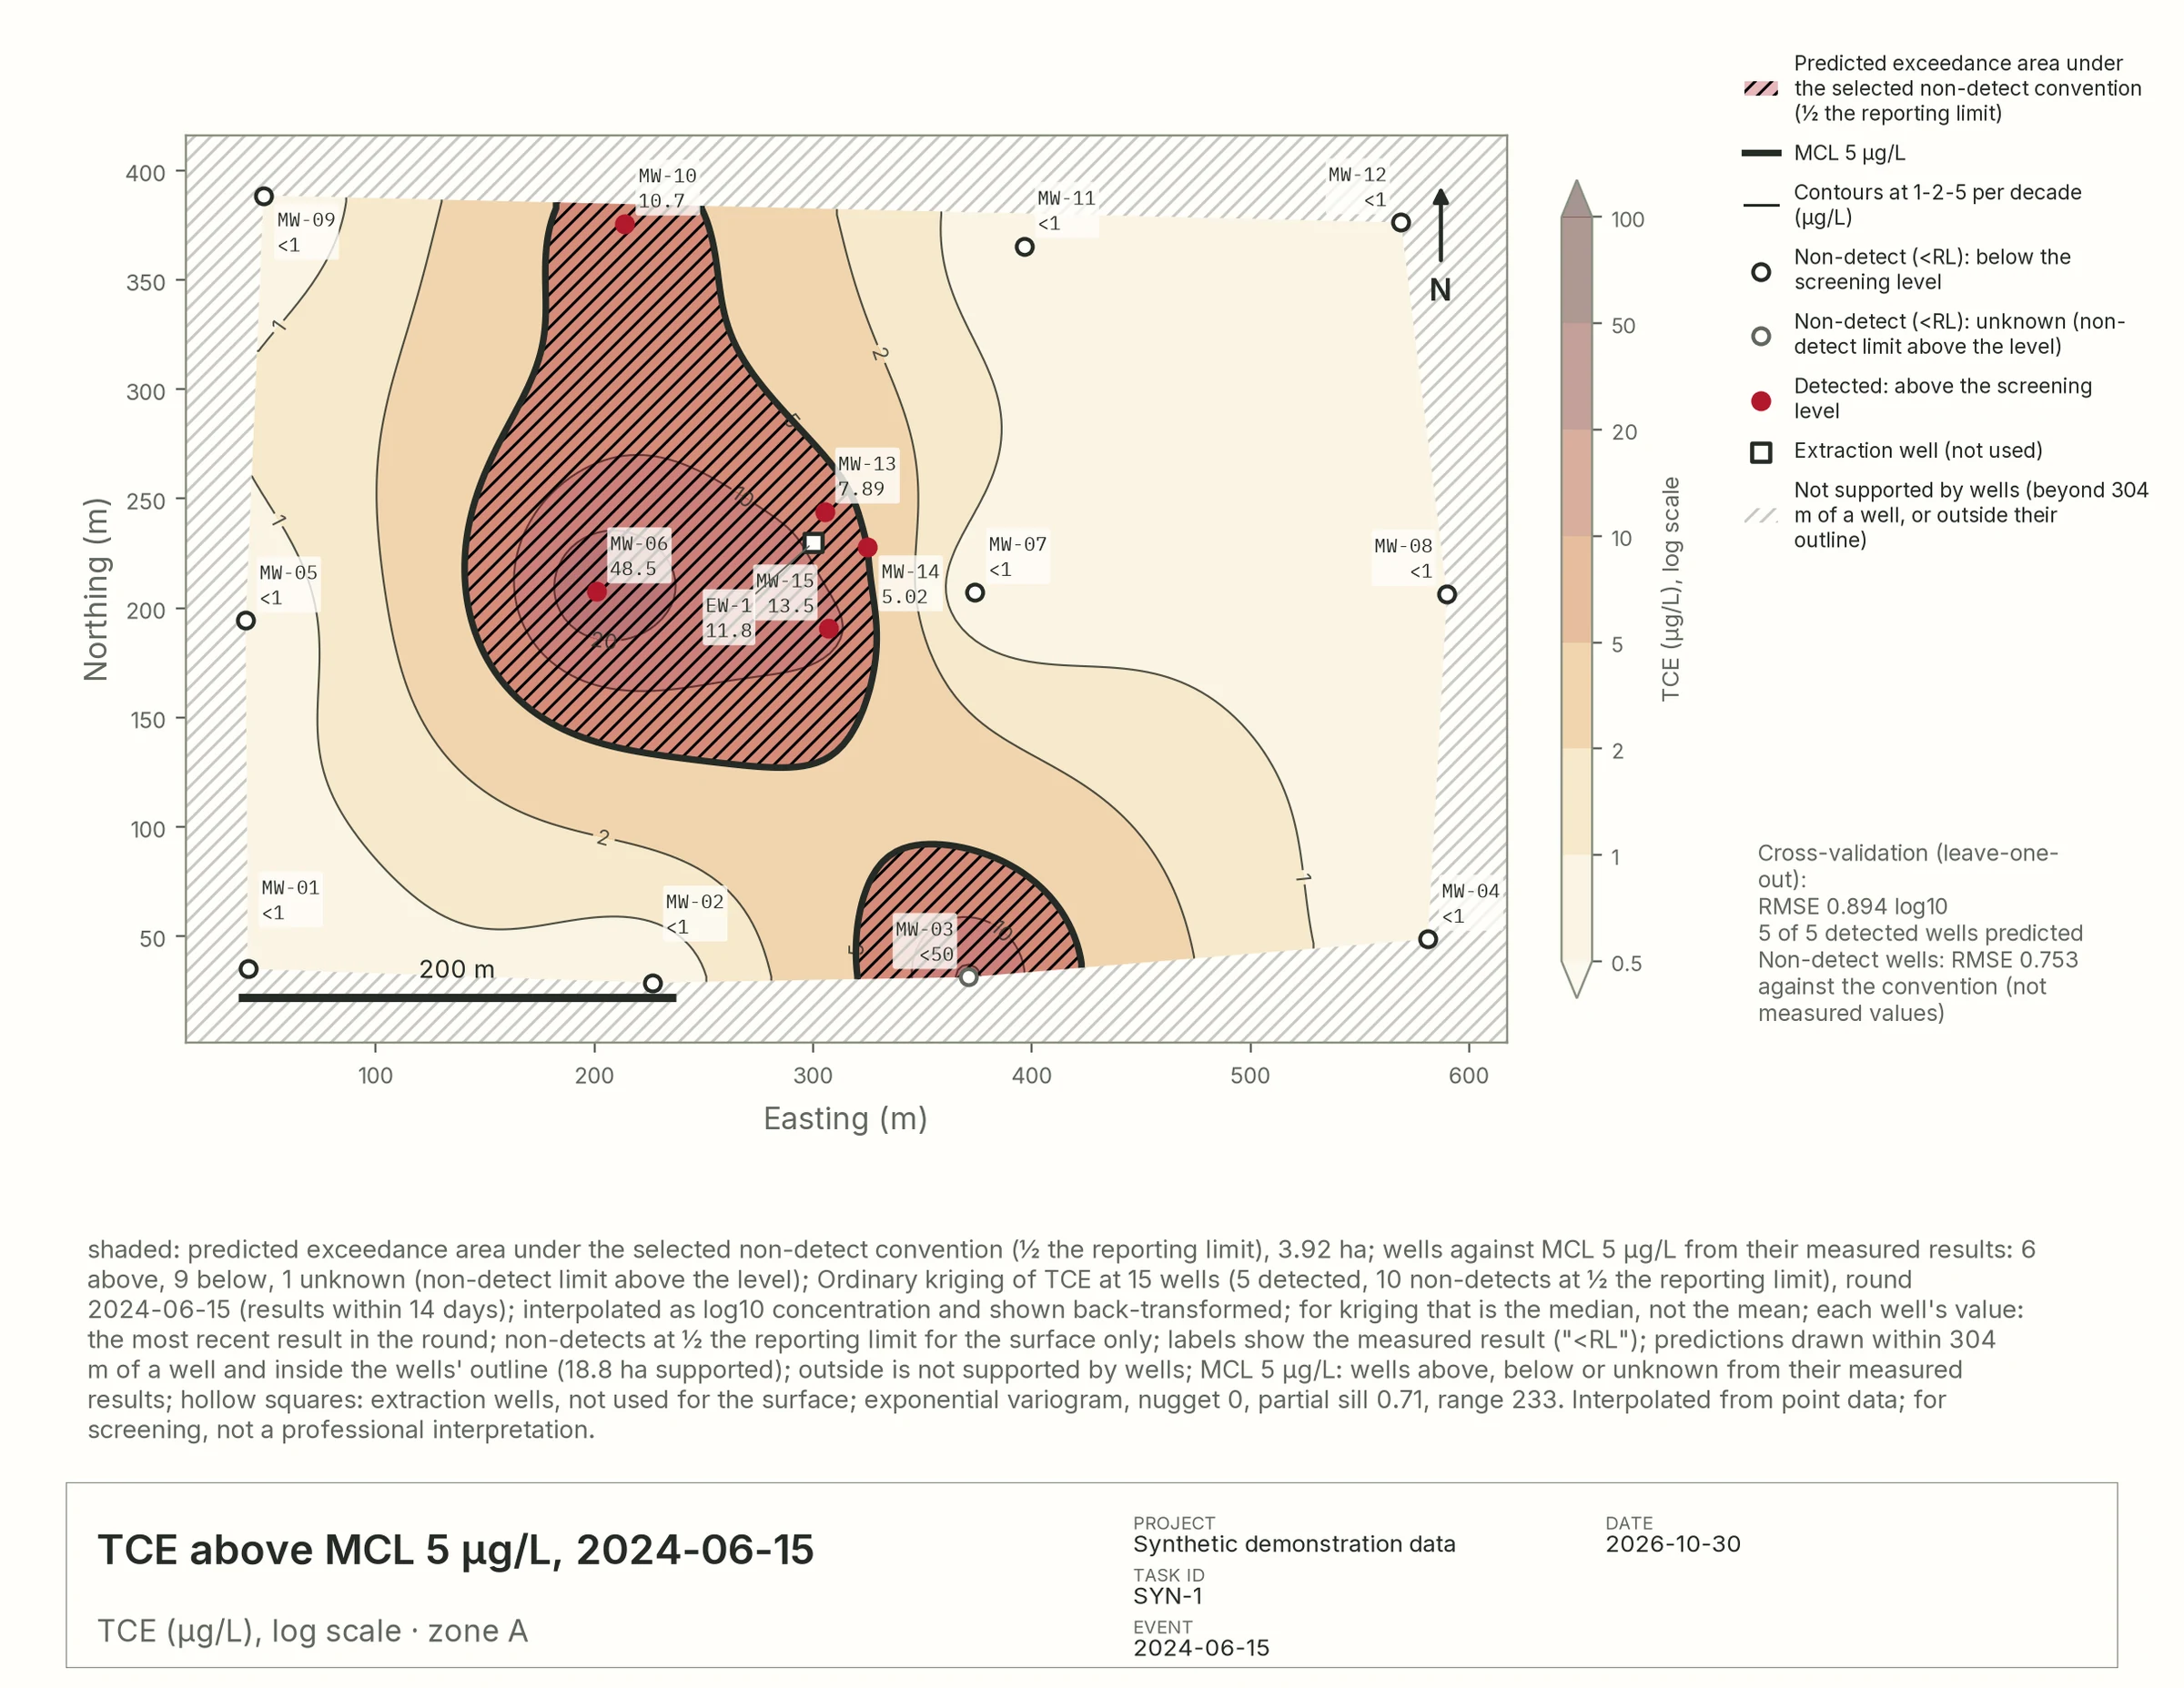
Plate I — TCE, 2024-06-15 · µg/L Every site, legible
Today's consulting reality

The data is everywhere. The answer is due tomorrow.

0 Pages of reports
0 Lab results
0 Disconnected tools

From site data to client deliverable.

Five steps in one shared workspace, with every number traceable from the first upload to the final report.

Step 01 / 05Bring it together

Everyone's files. One collaborative space.

Upload the whole archive into one shared workspace: reports, lab exports, field sheets, GIS layers, elevation models, scanned logs. Heavy files are processed on the server, never on your laptop.

  • Every format, from lab EDDs to scanned boring logs
  • Private to its members, by invitation and role
  • Large rasters and whole zipped folders
A torn strip of a photograph of steeply layered rock strata.
PDFPhase II report412 pages
XLSXAnalytical results38,204 rows · lab EDD
TIFElevation model280 MB
SHPSite boundaryzipped shapefile
CSVWater levelsquarterly
SCANBoring logsscanned pages

Also: EQuIS EDDs · Word · text · Markdown · JSON · TSV · XLSM · photos (PNG, JPEG, TIFF) · GeoTIFF · GeoJSON · KML/KMZ · Esri ASCII grids · layers from Esri ArcGIS and other map services · whole folders or .zip archives

Workspace · SYN-1Private

Groundwater sampling

  • PMProject managerManager
  • HGHydrogeologistEdit
  • FTField technicianEdit
  • CLClient reviewerView

Shared with your team. Private to its members.
Data & filesOn the server
Phase II report.pdfSearchable
lab_results.xlsx4 tables
elevation.tifOverview built
Step 02 / 05Ask

Ask your data. See the source.

Ask Hydrobase the questions you'd ask a colleague. Answers come from your own reports, tables, maps, and field records, with every result linked back to its source.

  • Tables, reports, and maps searched in one question
  • Traceable: click any number to open its row or report page
  • Reads charts, scanned pages and photos, not just text
  • Your choice of model: Claude, OpenAI or open-weights
A groundwater monitoring well casing among dandelions in a ploughed field.
Ask · SYN-1Opus 5 ▾

The highest result was 48.5 µg/L at MW-06, down from 193 µg/L in 2022. Six of sixteen wells are above the 5 µg/L screening level.

Sources · +1 rowlab_results.xlsx
Row Well Date TCE Units
1182 MW-06 2024-06-15 48.5 µg/L
Can you run this chart across the rest of my wells?

Done: the same hydrograph for all 16 wells, one setup, every round.

MW-01
MW-03
MW-05
MW-06
MW-08
MW-10
MW-12
MW-14
16 wells · 12 rounds · one scale
Step 03 / 05Chart at scale

Set the method. Scale the analysis.

Build a figure once (your method, non-detect handling, and scale), then run it across every well, round, and analyte in the project with a single click.

  • Every choice is written on the figure
  • Methods compared side by side, never ranked
  • AI drafts it; you decide what ships
  • Click any part of a figure to restyle it
Build a chart Close
Analysis category Contaminant plume & groundwater chemistry maps
Contours Filled Exceedance Comparison Change
▸ Data TCE · 2024-06-15 · zone A · 16 wells
▾ Interpolation Ordinary kriging · log10
  • Ordinary kriging
  • Thin-plate spline
  • Inverse-distance weighting (IDW)
  • Triangulation (linear TIN)
  • Kriging with drift (KT3D)
Non-detects in the surface ½ the reporting limit (stated on the map) ✓Interpolate log10 concentrations
▸ Overlays MCL 5 µg/L · flow direction · labels
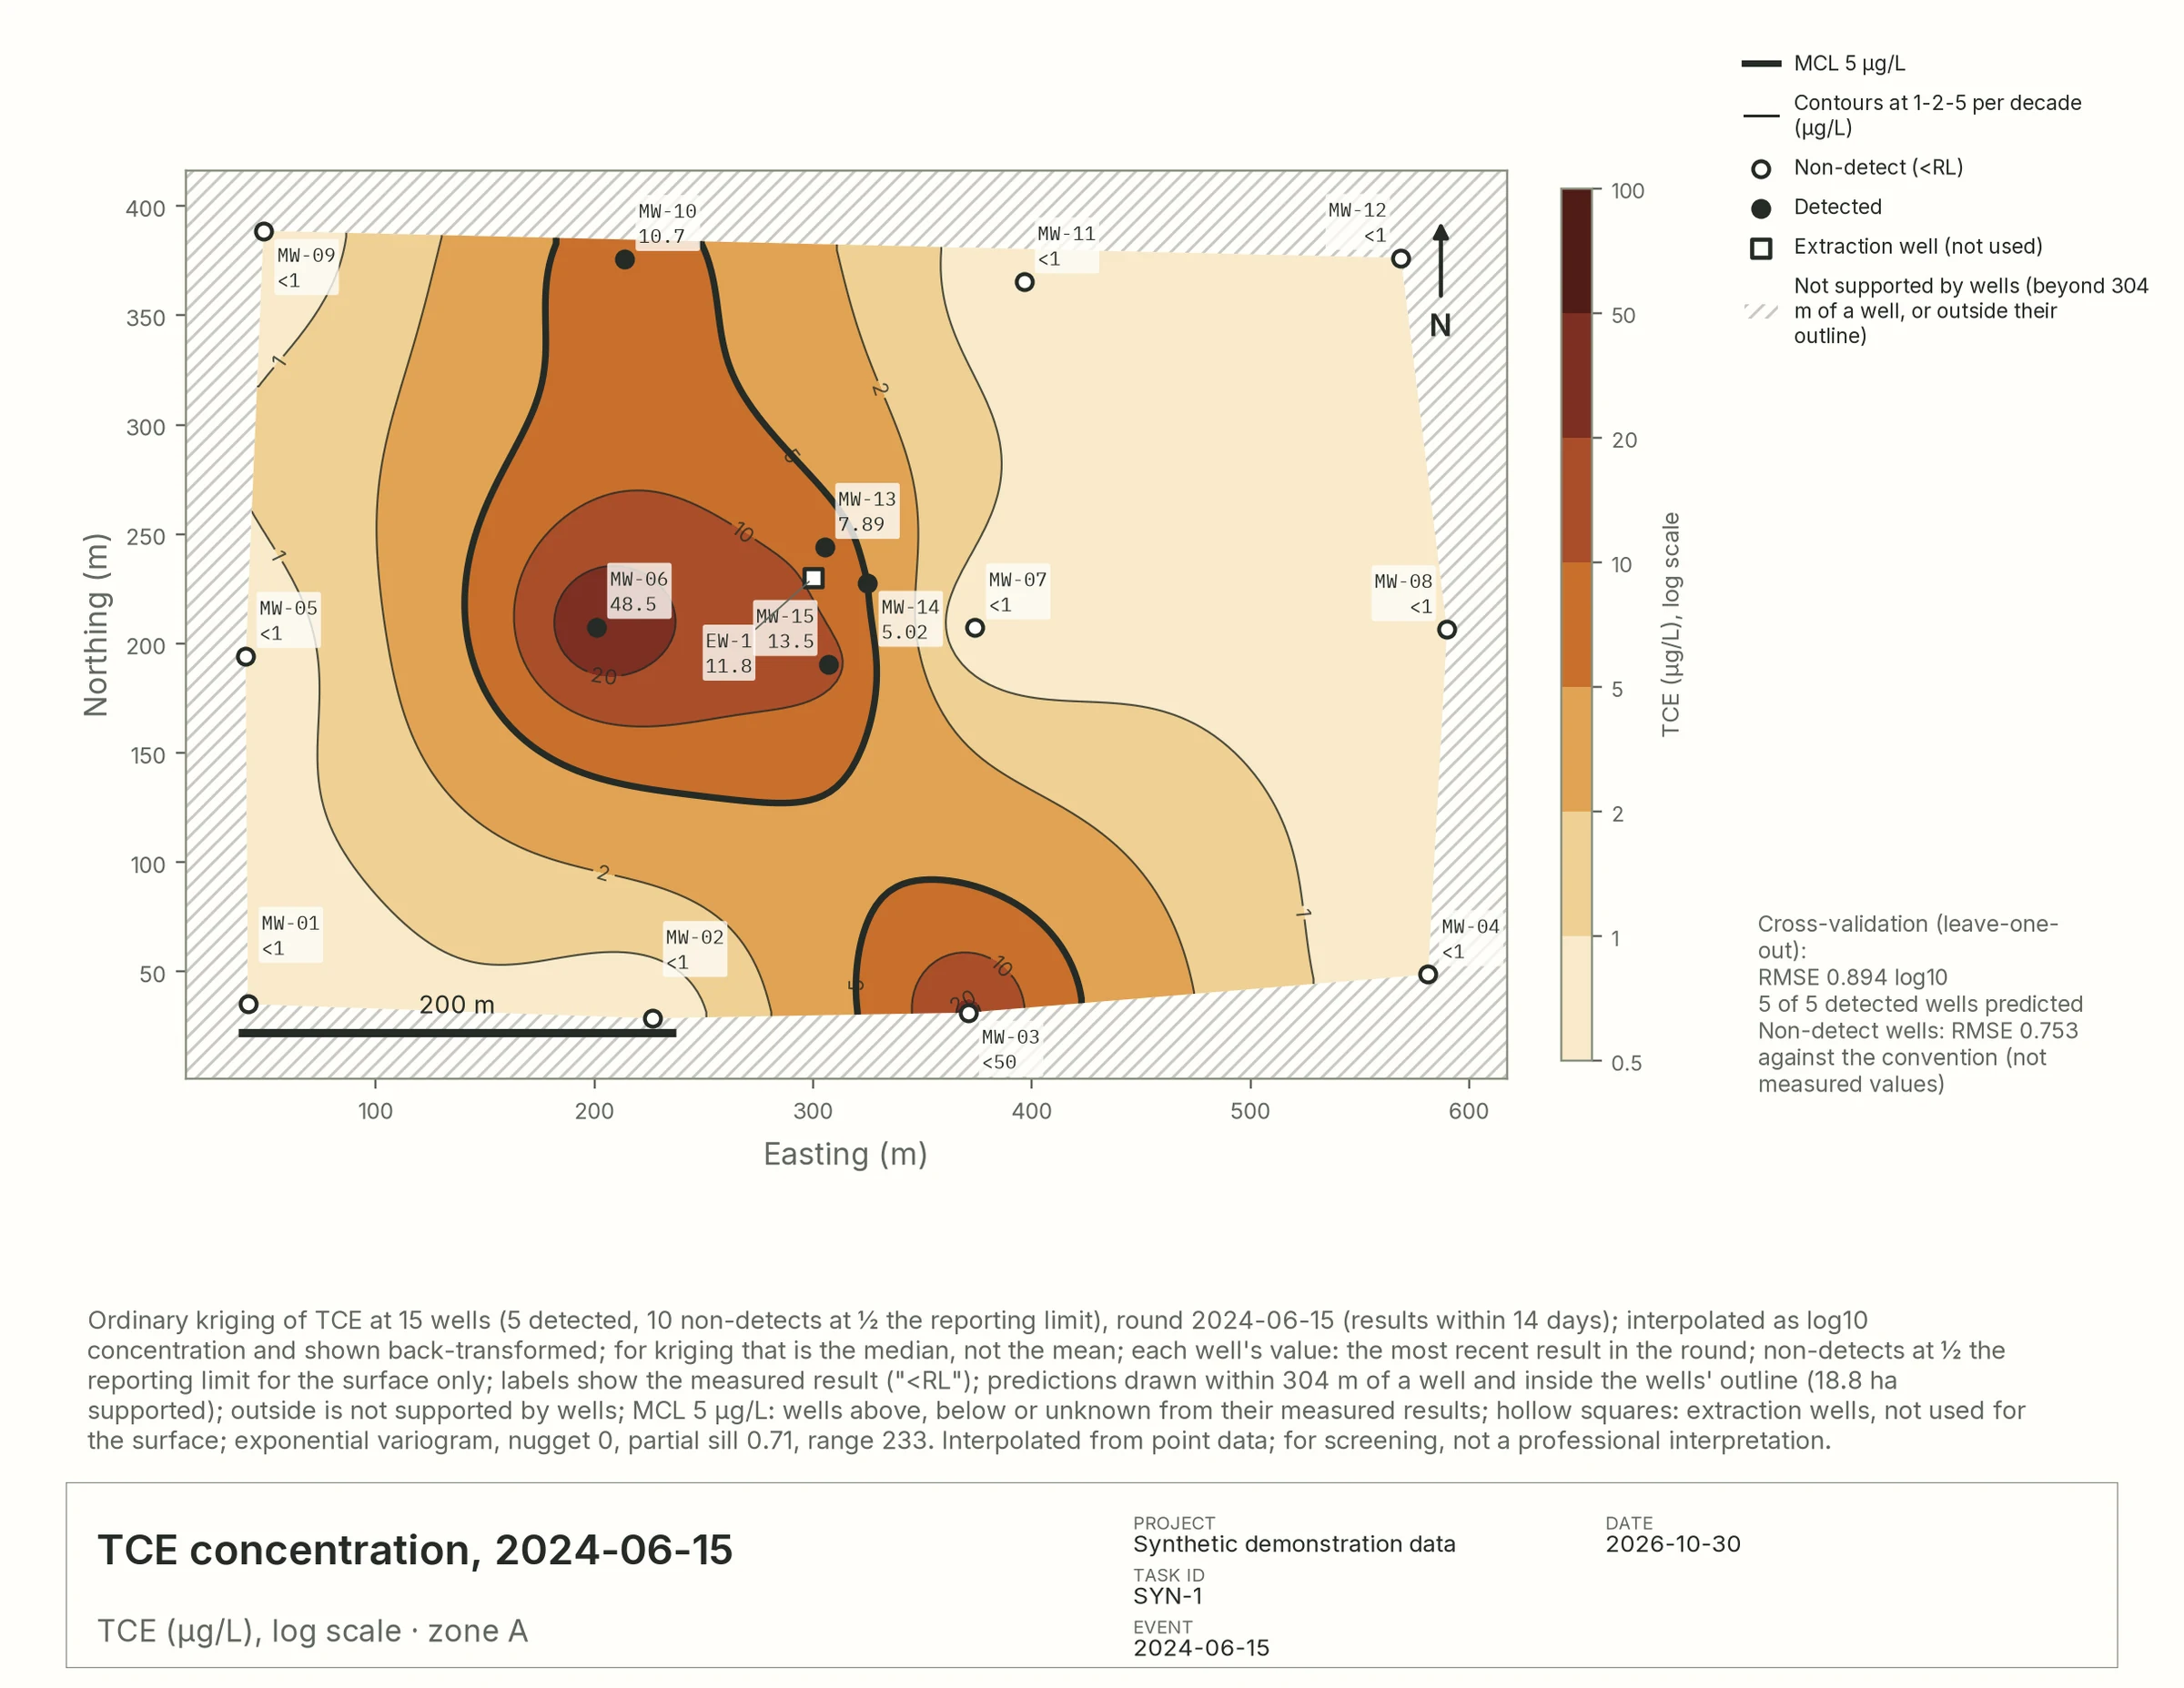
TCE concentration, 2024-06-15
Filled TCE concentration surface for one sampling round, redrawn for the chosen interpolation method.
Cross-validation RMSE 0.894 log10 · 5 of 5 detected wells
Data mapping… Cancel Add to chat
What one setup produces Choose a frame · click to enlarge
Synthetic site · drawn by Hydrobase
Step 04 / 05Draft together

Turn findings into a report, together.

Bring project managers, technical experts, and reviewers into the same document. Draft together, comment in context, request revisions, and keep every finding linked to the data behind it.

  • A built-in editor, like a doc that knows your data
  • Comments, roles and reviews on the page itself
  • No zip files or tracked changes by email
  • Traceable: figures stay pinned to the data they were reviewed with, and every number links to its row
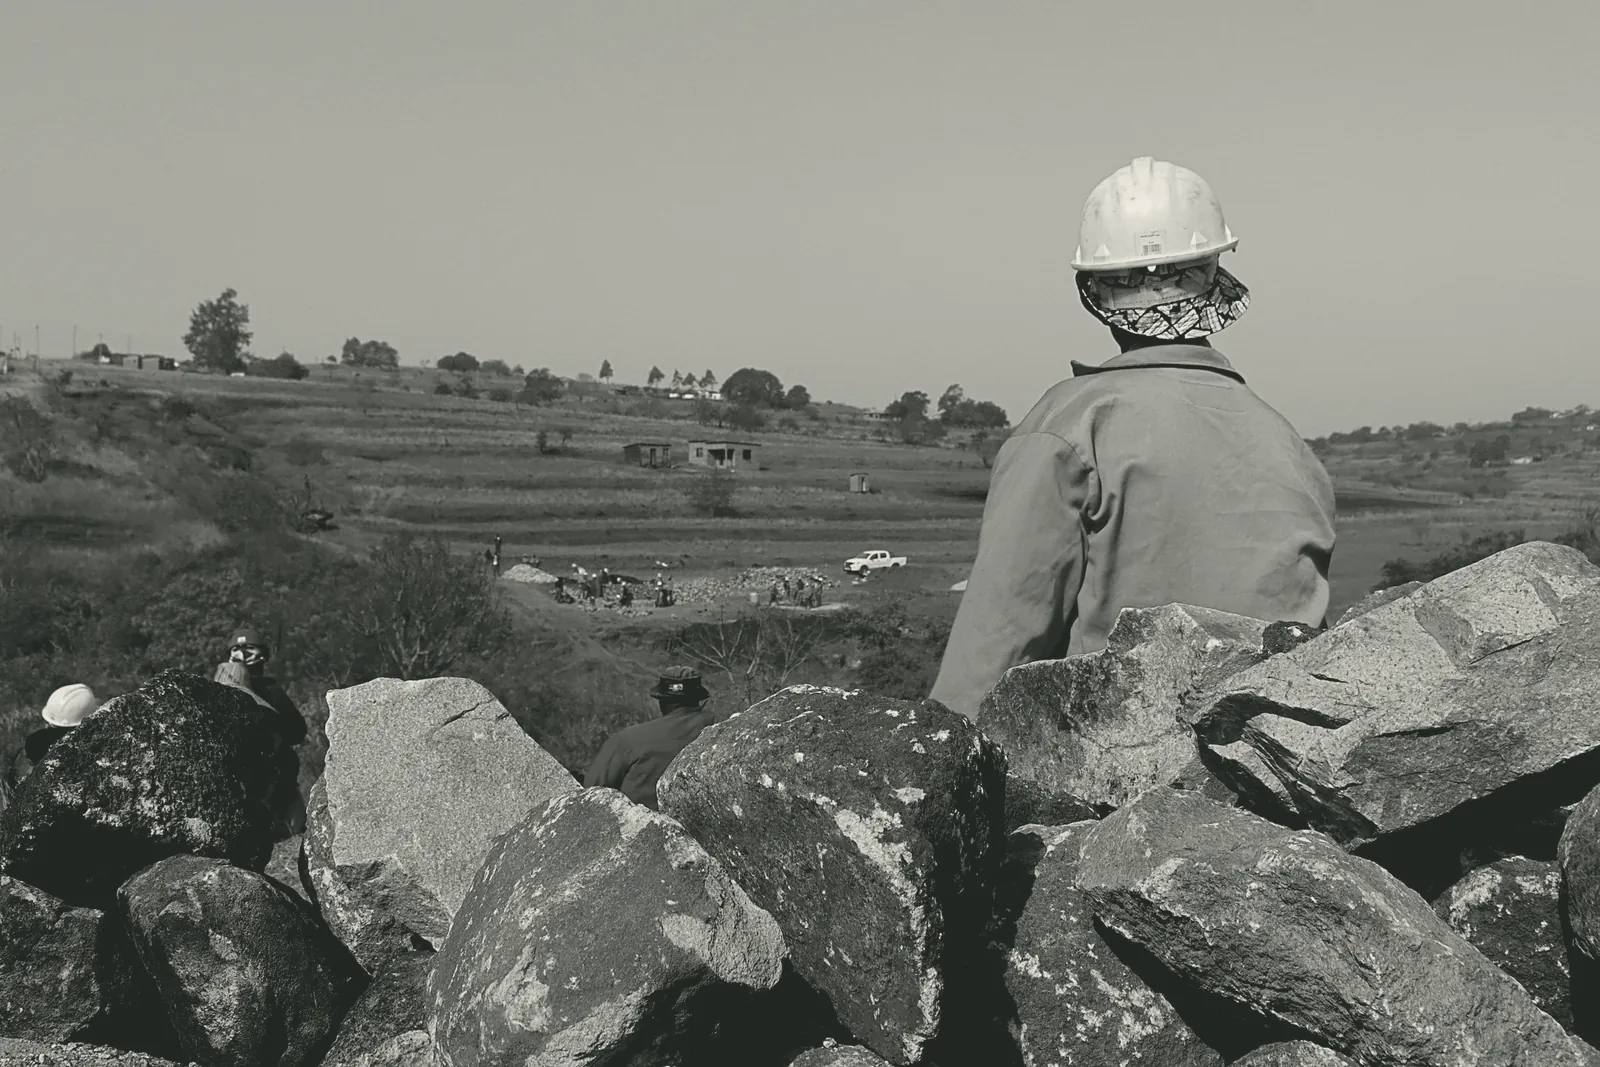
Black-and-white photograph of a worker in a hard hat looking out over a site from behind a stone wall.
Q2 monitoring report Draft PMHGCL Saved

Groundwater monitoring, second quarter 2024

Results

TCE remains above the 5 µg/L screening level at six of sixteen wells, with the highest result 48.5 µg/L at MW-06HG, down from 193 µg/L in 2022.

48.5 µg/L ← row 1182 · lab_results.xlsx

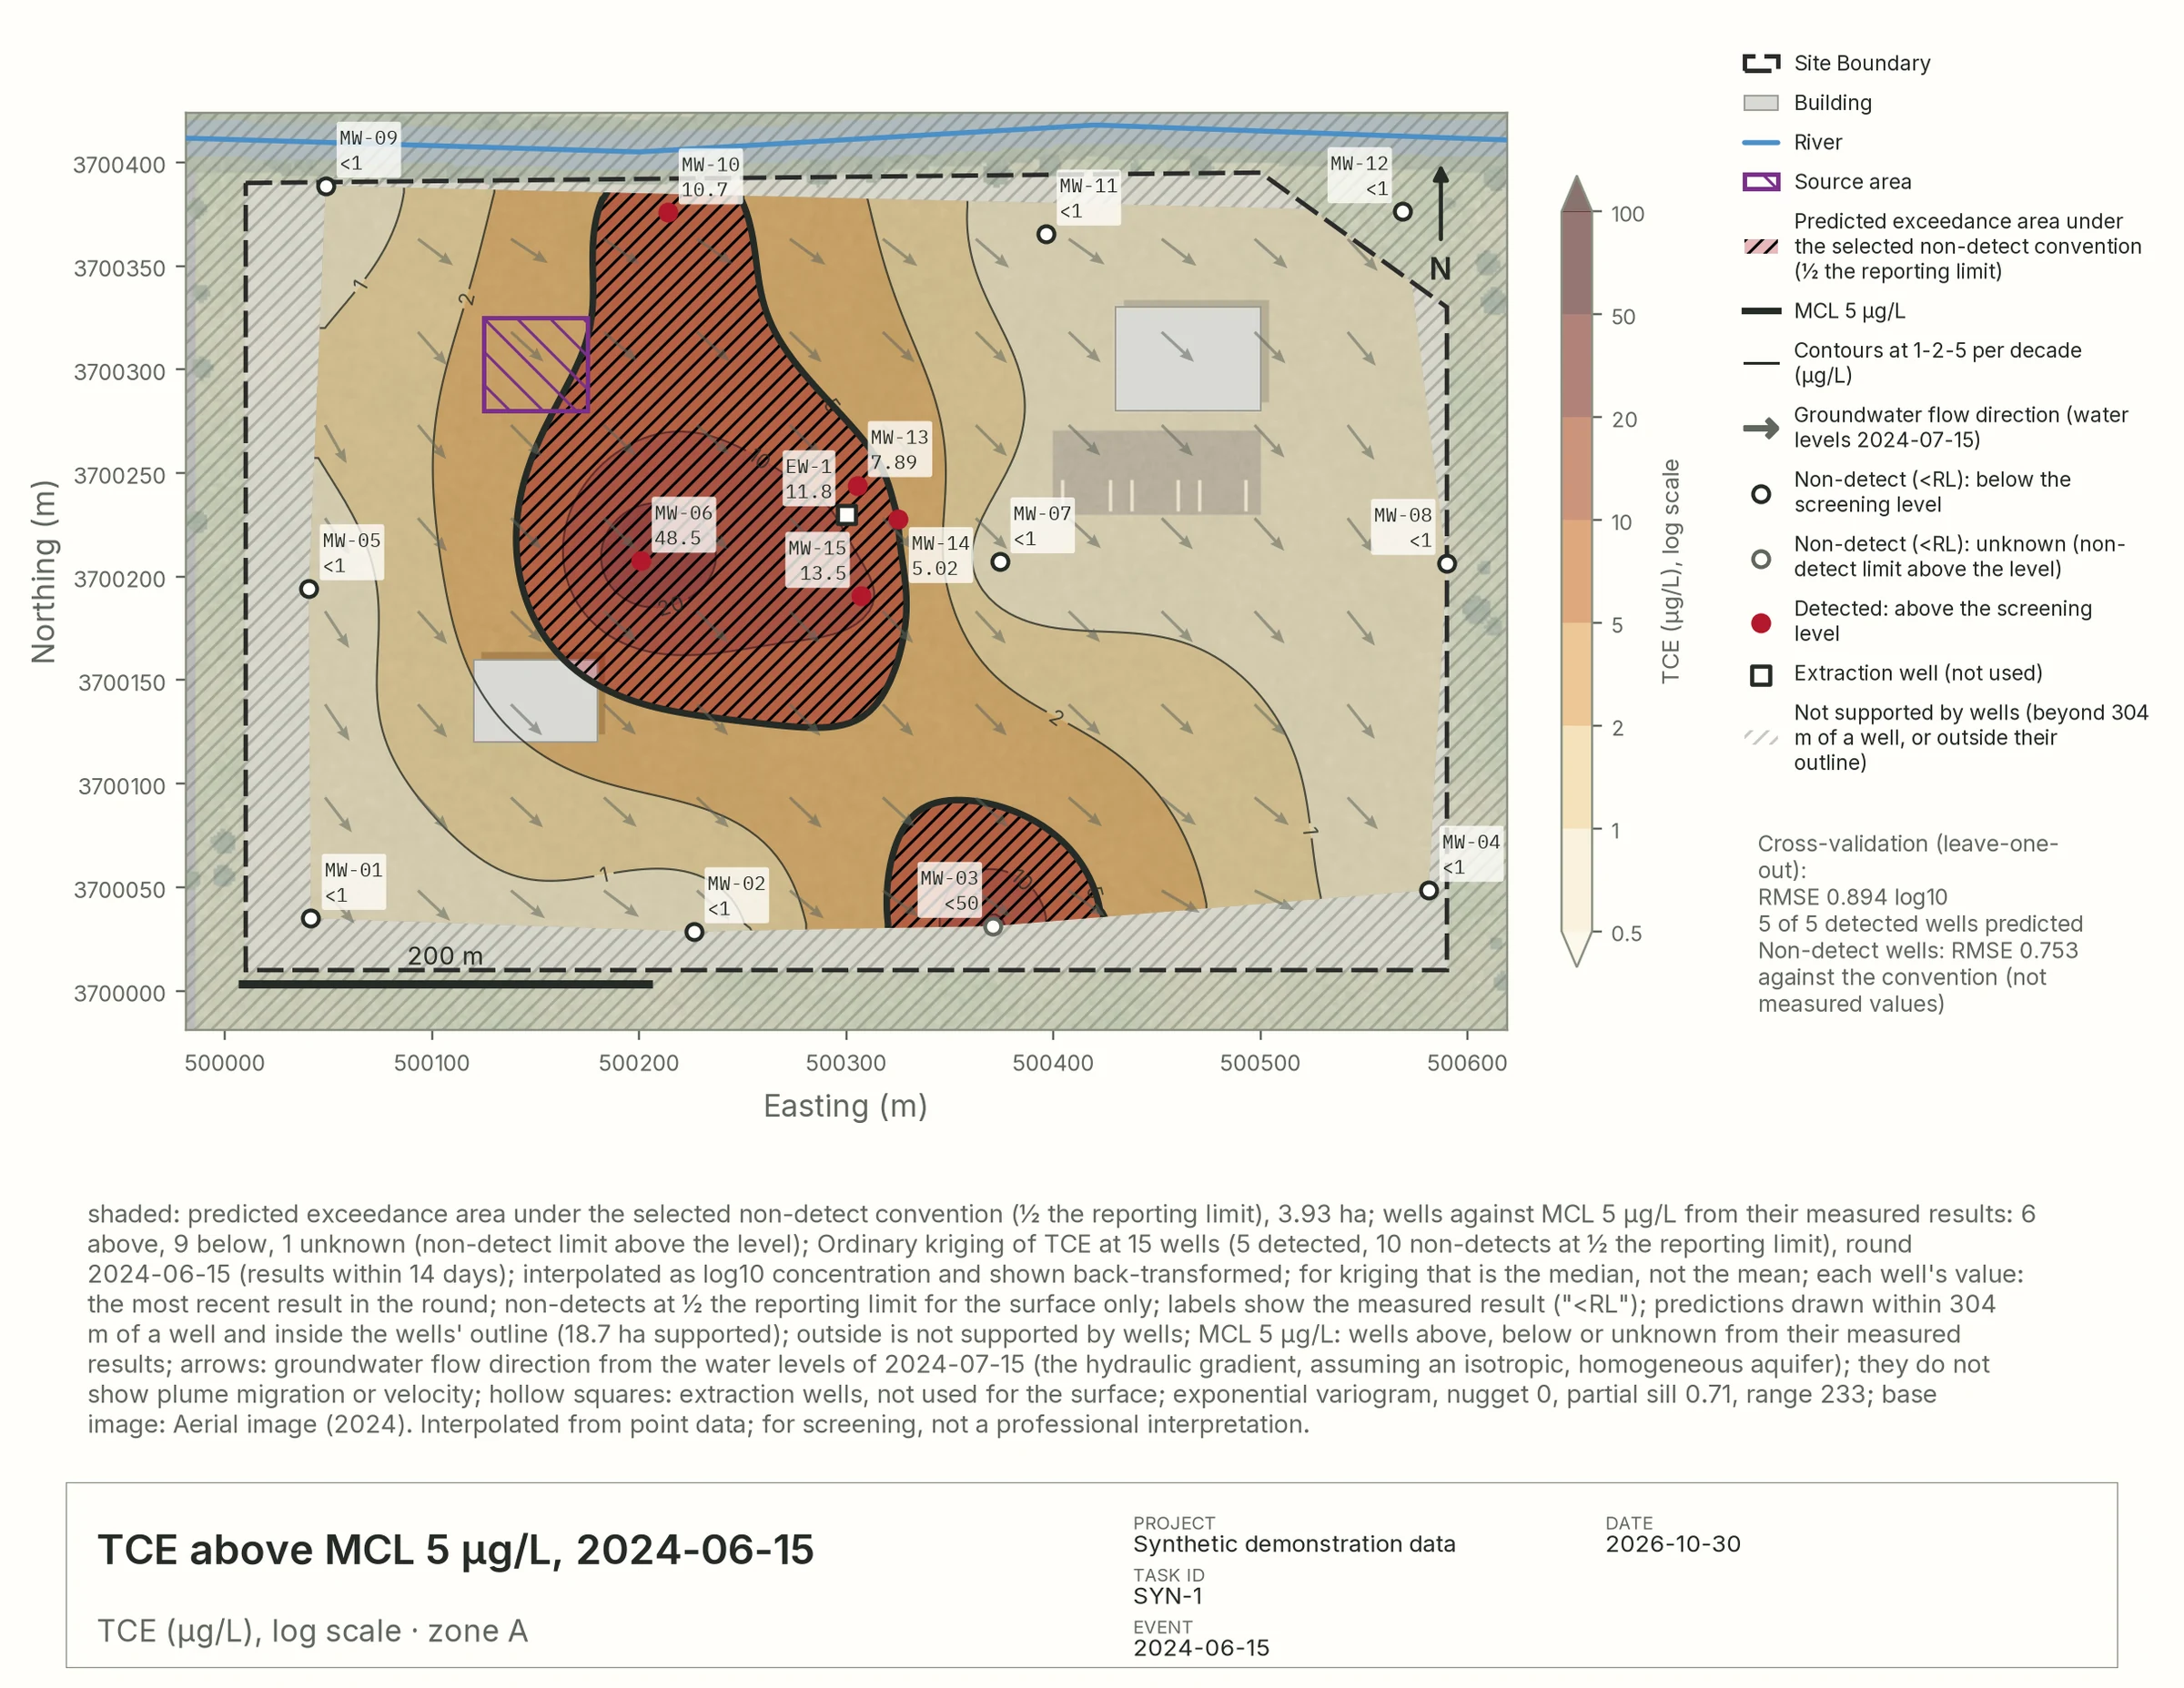
Exceedance map placed in the report.
Figure 2. TCE above MCL 5 µg/L, 2024-06-15 · pinned to its data
Well TCE (µg/L) vs MCL
MW-06 48.5 Above
MW-13 7.89 Above
MW-03 <50 Unknown

The plume has contracted toward the source area since 2022PM and the area above the level fell from 8.3 to 3.9 ha.

Step 05 / 05Deliver, fully traced

Deliver work that can be traced, reviewed, and reused.

Export client-ready reports in Word or PDF that stay connected to the data, figures, and review history behind them.

  • Version history on every document
  • Charts inserted and revised in place
  • Styled PDF and Word, ready for the client
  • Next quarter's report starts from this one: same figures, new data
Insert a chartSuggested

Insert the exceedance map after “Results”, with its caption and sources?

AcceptDiscard
VersionsQ2 report
  1. v6Exceedance map inserted HG
  2. v5Summary tightened PM
  3. v4Trend table edited Edit
  4. v1Saved from chat Original
Groundwater monitoring report

Second quarter, 2024. Synthetic site, zone A.

Screening-level exceedance map used as the report's cover figure. Prepared with Hydrobase · PDF · Word
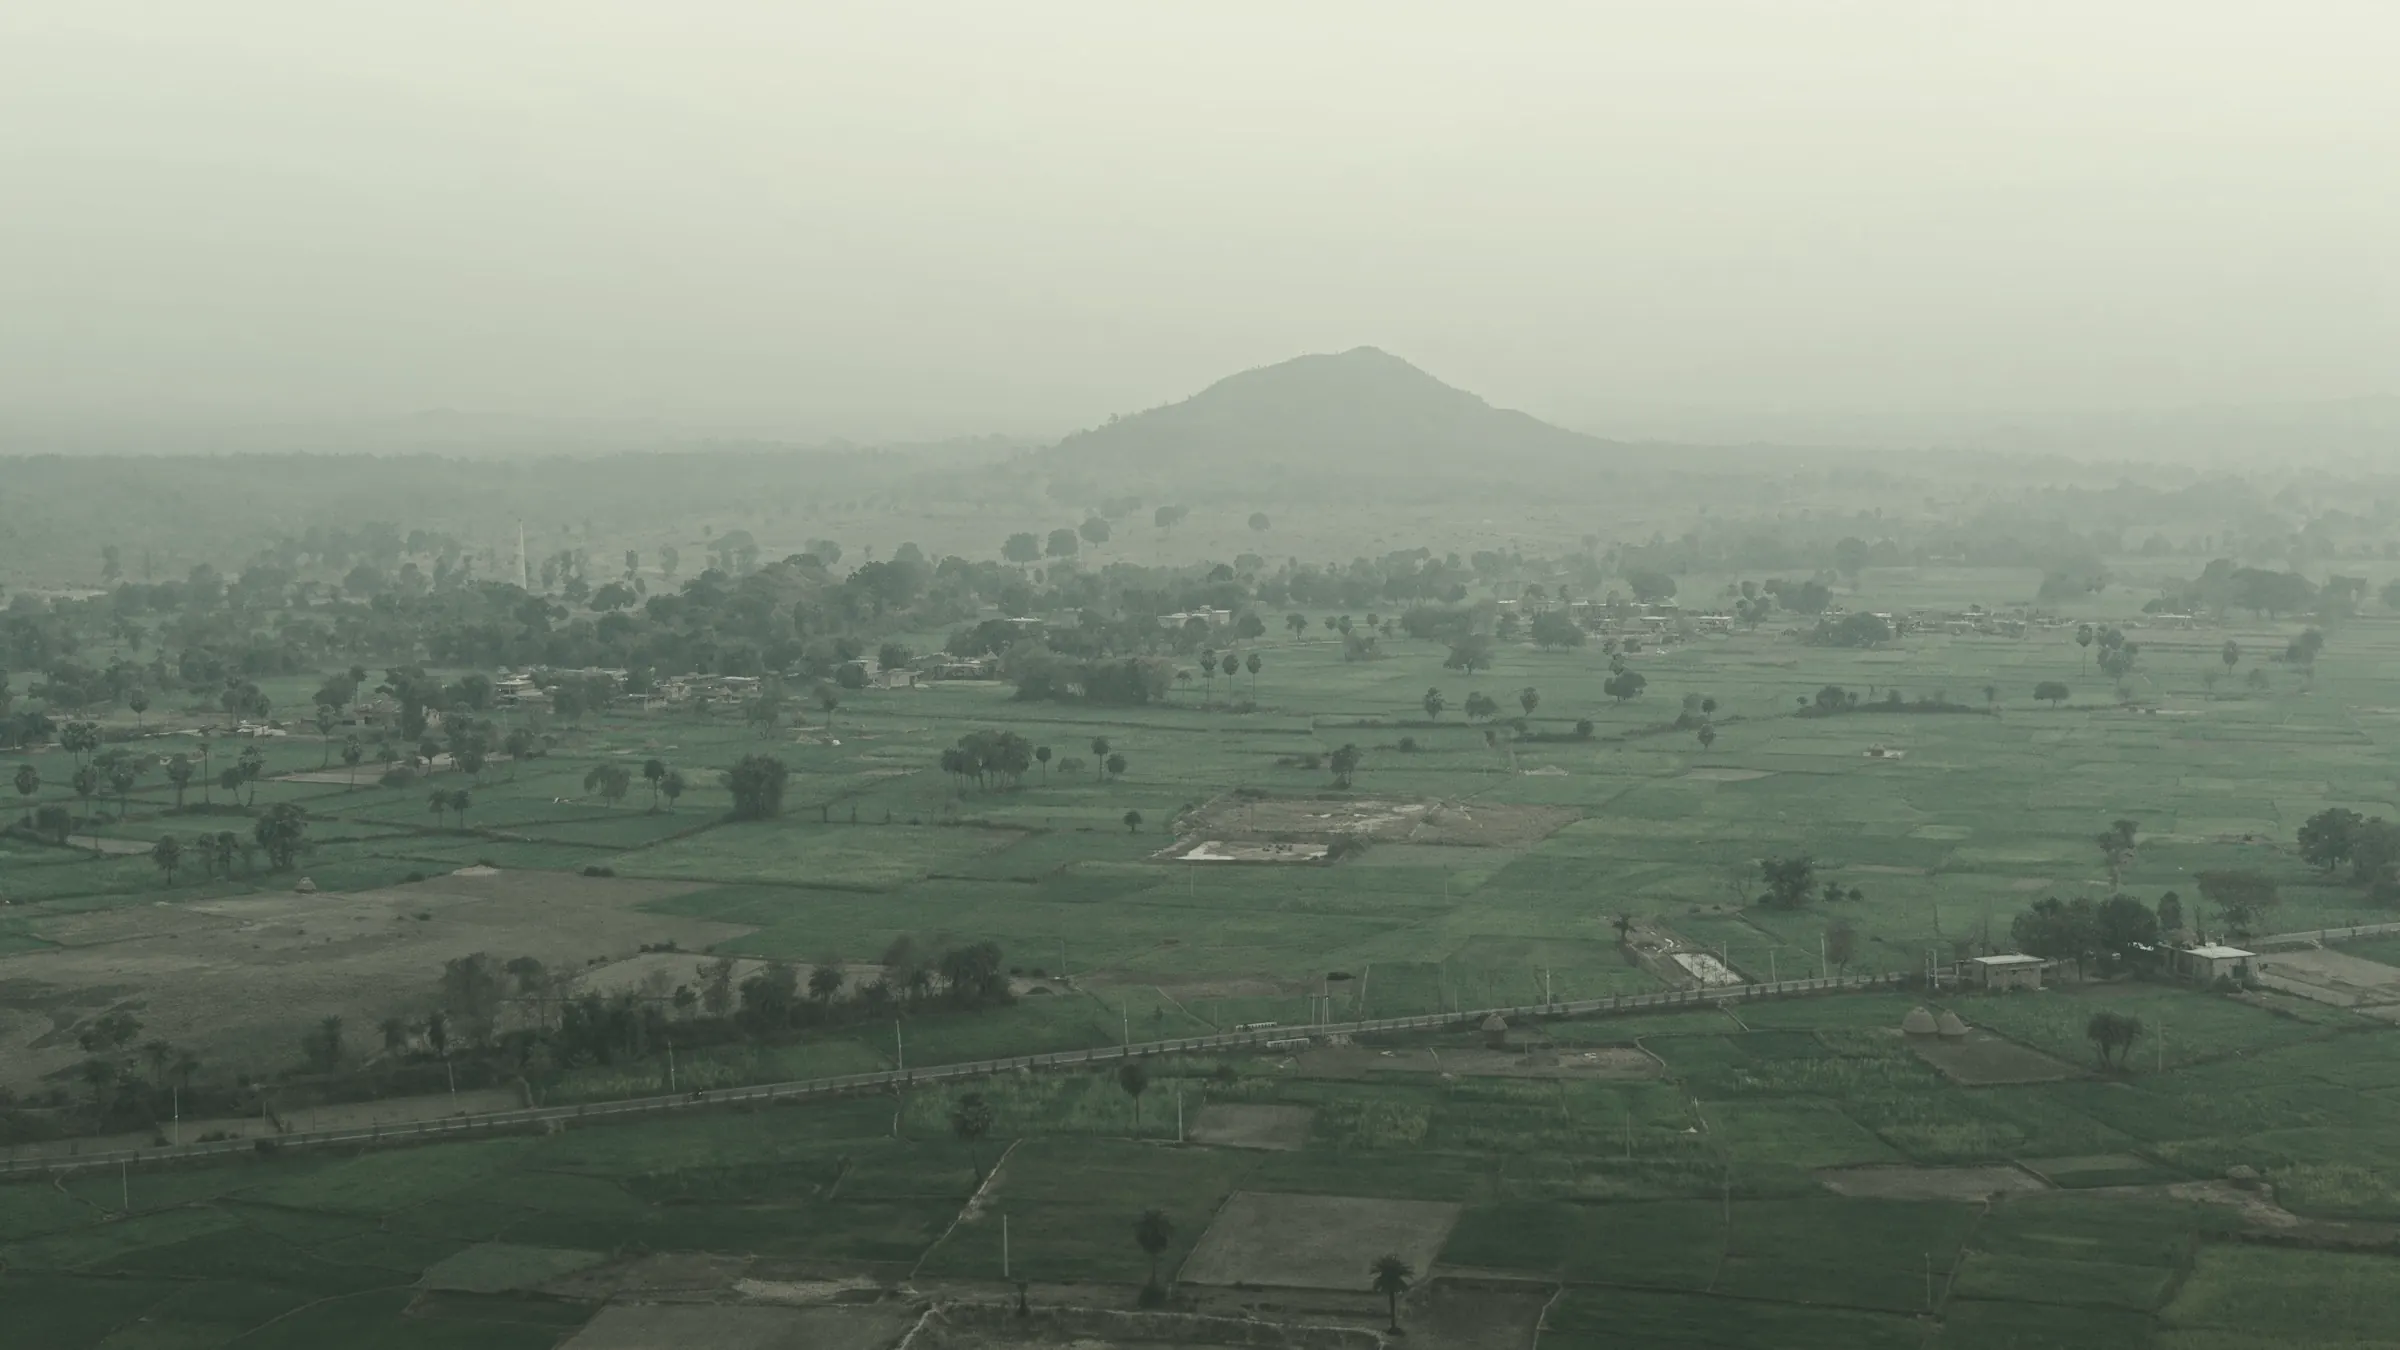
A misty valley of fields with a lone hill on the horizon.
Anywhere

Work from anywhere.

Hydrobase runs in the browser on any device. Review the report on a tablet between site visits, check a number from the field, approve a figure in transit. All it needs is wifi.

Q2 monitoring report Review PMHG

Results

TCE remains above 5 µg/L at six of sixteen wells; the highest is 48.5 µg/L at MW-06.

Exceedance map in the report, on a tablet.
PM
Project manager

Approved for the client.

HydrobaseSYN-1
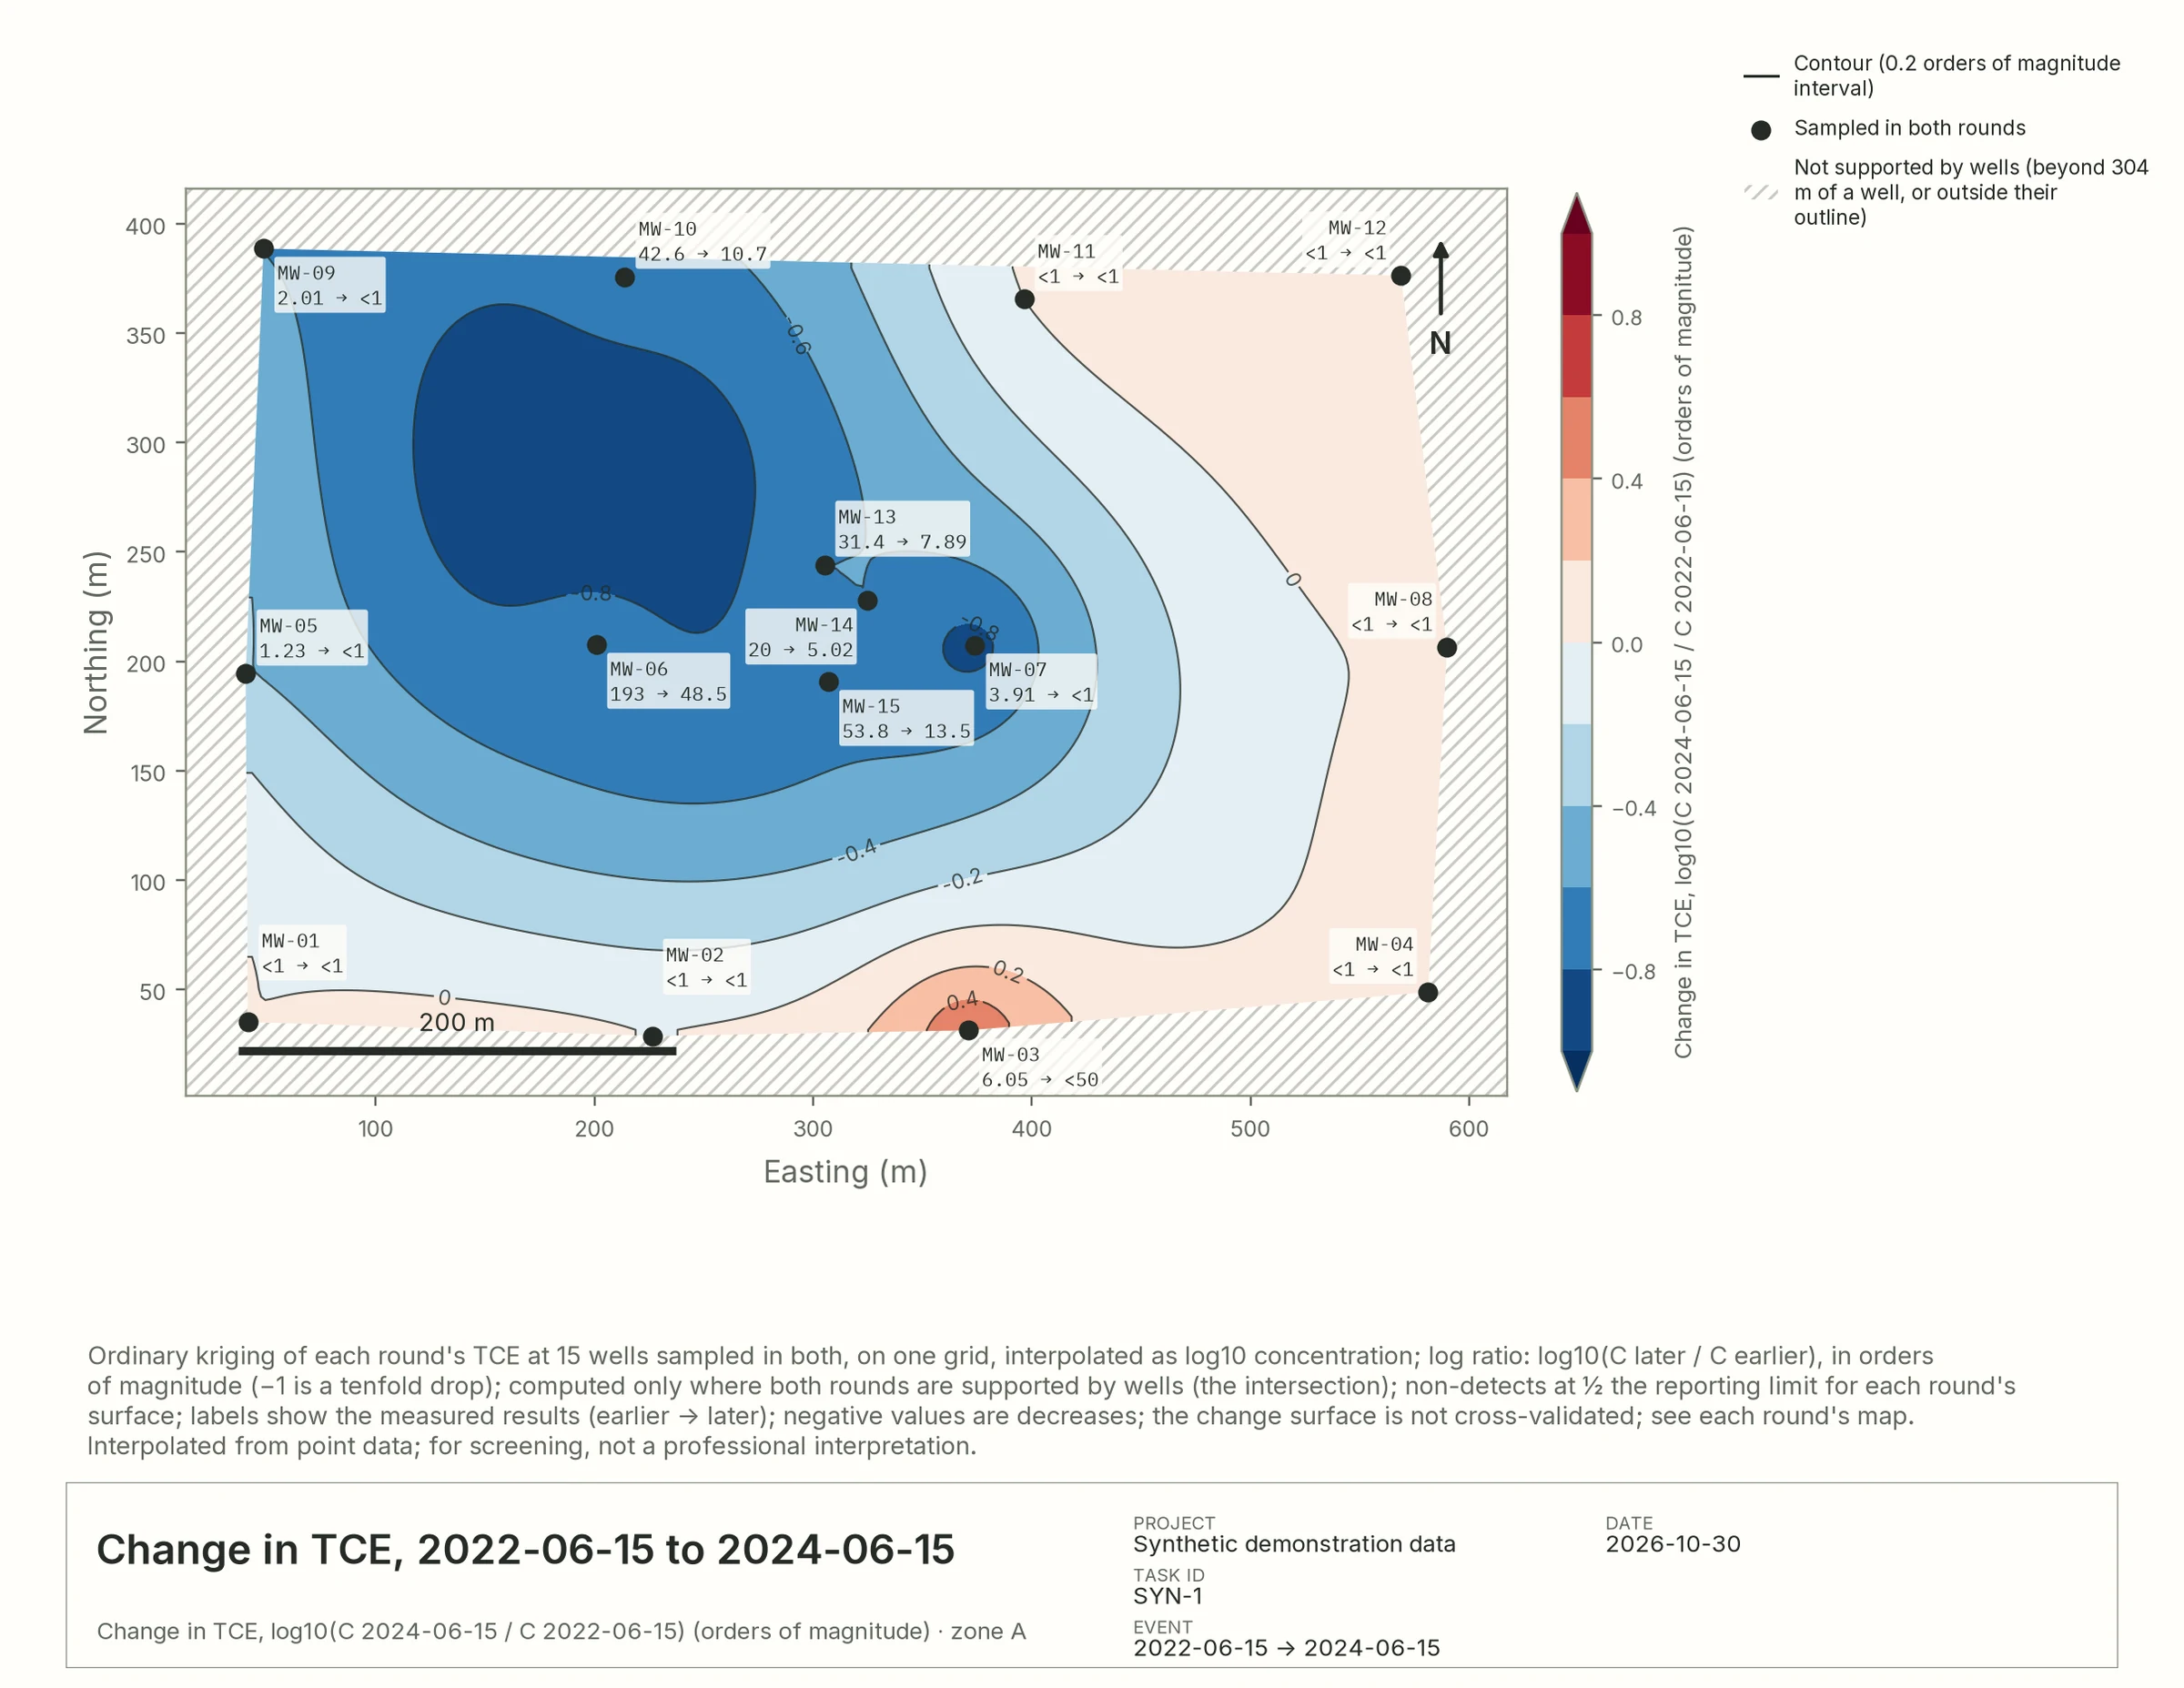
Has the plume shrunk since 2022?

Yes: the highest result fell from 193 to 48.5 µg/L, and the area above 5 µg/L from 8.3 to 3.9 ha.

Plume change map: log ratio of TCE between 2022 and 2024, mostly blue where concentrations fell. Sources · 30 rows
Field notes

Built to be checked.

Environmental decisions have to be explainable, defensible, and reviewable. Hydrobase makes analysis faster and more consistent, while keeping professional judgment, traceability, and QA/QC at the center of every deliverable.

  1. Every number has a source.

    Answers and figures link to the exact rows and files they came from.

  2. Non-detects stay non-detects.

    "<1" is shown as measured; any substitution is a stated, labeled choice.

  3. Maps admit their limits.

    Each map hatches where wells don't support it and reports how each method cross-validates.

  4. Your data is never rewritten.

    Questions run read-only against your tables; the originals stay as uploaded.

  5. Each project stands alone.

    Every project has its own data, people, and budget; nothing crosses between clients.

Who it's for

Everyone on the project, from the field to the client.

For hydrogeologists, environmental scientists and engineers: groundwater monitoring, statistical trend evaluation, geostatistical interpolation, contaminant plume characterization, aquifer testing, conceptual site models and technical reporting.

Field & technical staff
Upload field sheets, logs and lab results once.
Hydrogeologists & geologists
Maps, trends and non-detect-aware statistics.
Environmental scientists
Compliance against screening levels, well by well.
Engineers
Remediation, civil and geotechnical designs grounded in the site's own data.
GIS & data managers
One mapped source of truth instead of scattered copies.
Project managers & principals
Review the whole process and trace any finding.
QA/QC reviewers
Every number back to its row.
Clients & regulators
Clear, consistent deliverables.
Groundwater monitoring Data center siting & water supply Site investigation & remediation Environmental due diligence Compliance & permit reporting Landfill, mine & industrial sites Water resources & wellfields Geotechnical & infrastructure

Built to scale with your practice.

Organize work by client, project, and office while keeping data secure and isolated. Control access by role, preserve project boundaries, and keep full ownership of your data.

Pilot

Start with one site.

  1. 01Send one site's reports, lab data and GIS files.
  2. 02We set up the workspace and map the data with you.
  3. 03Your team asks questions, builds figures and drafts a deliverable.

Or write to pilot@hydrobase.ai. Your data stays in its own workspace.